Guest Post: Follow the Money: YouTube’s Failure to Pay Retroactively Gives “Conversion Rate” a Whole New Meaning

[Cross-posted from MusicTechPolicy]

by Chris Castle

Conversion

A performance metric one hears from the digerati is the term “conversion rate.”   “Conversion rate” for a streaming service usually means the rate at which users of an ad-supported free service are “converted” to paying users.  That motivation is usually because they are so fed up with the advertising they are willing to pay.  (This was one of the many failed pitches from Spotify before people stopped trying to justify hanging on until the IPO riches flowed in.)

YouTube, of course, has never been too terribly interested in anything that moves users away from advertising.  That resistance (and potential internal competition between the massive ad sales team and the ever changing YouTube managers), may explain the many failed efforts at launching a YouTube subscription service by a company that knows more about user behavior than anyone in history.  They just couldn’t seem to get it right for the longest time.  You don’t suppose that YouTube’s apparent lack of interest in getting large numbers of users to substitute away from free to subscription was because YouTube made a lot more money from the ads than they ever would from the subscriptions?

One of the ways that YouTube (and Google) makes money from advertising is by taking money that is not theirs to take (sometimes called “monetizing” content).  The civil law calls that act a claim of “conversion” and   the criminal law calls it the crime of “theft”.  Conversion and theft are two sides of the same coin and often one implies the other, albeit with different burdens of proof.

theft

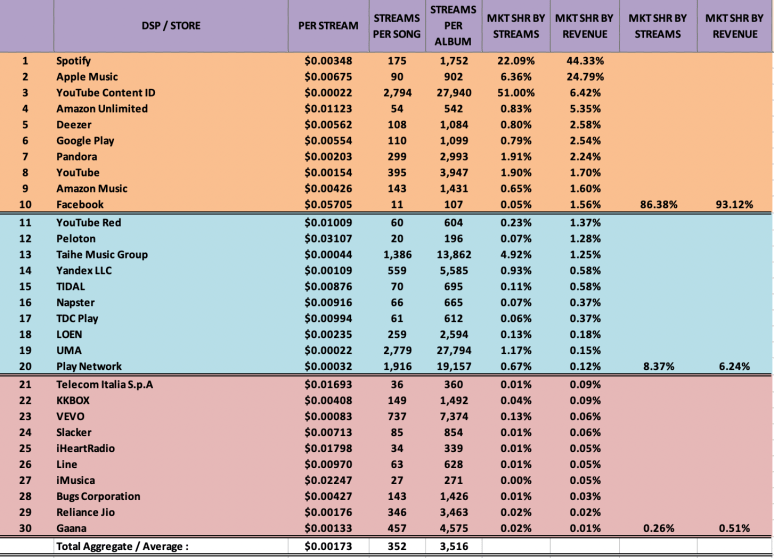
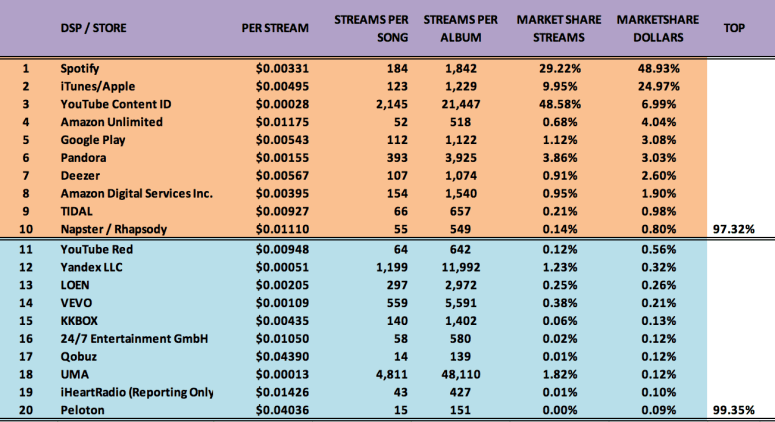
YouTube’s Content ID tool is a way for copyright owners to block or permit advertising on user-generated content that includes their copyrights, often music.  Users of Content ID will tell you that it works just well enough that Google can say it is an effective tool, but even with Content ID music still gets through (and is often monetized by YouTube) for a variety of reasons.  This requires time consuming and costly manual searches.  Companies like AdRev make it a bit easier, but are essentially third party Content ID users.  These companies are compensated with a commission on infringing works they find on YouTube that they convert–there’s that word again–from infringing to monetized, which means that YouTube now splits the advertising revenue with the copyright owners who in turn split their share with an AdRev.

But see what happened there?  If you have Content ID, you can block on the upload some of the time, or you can do a search.  If you don’t have Content ID (see Maria Schneider’s class action) then you can’t block on the upload only chase the infringements manually.  But quite rightly from an economic perspective, companies like AdRev are not that interested in doing that work on a rev share basis if there’s no rev share when you block.

Here’s the point–you have a property right in your copyright.  You have a property right to license that copyright.  Any revenue derived from exploitations of that copyright is your money.  YouTube uses its monopoly power to impose a deal to monetize your copyright (under duress, of course, due to whack a mole DMCA).  That deal involves a revenue share.  (Let’s just assume you decide to take the King’s shilling and accept Google’s deal under duress which you shouldn’t have to do and which may not even be enforceable.)

The question is, when should that revenue share attach–when they start exploiting your copyright in violation of your property rights or when you catch them doing it.  And if (1) you catch them violating your property rights and (2) agree to monetize, when should they pay you your agreed upon share of the revenue from monetizing?  Should they pay retroactively to the first exploitation?  Or only prospectively after you catch them?

The correct answer is they should pay retroactively.  But they don’t.  They just keep the money.  For millions of infringements.  And they get away with it because of their monopoly power, which leaves one choice most artists won’t make, which is to sue them like Maria has.

Remember–Content ID operates largely like any other fingerprinting tool.  (Psychoacoustic fingerprinting is old technology–remember Jonesy in “The Hunt for Red October”?  That’s fingerprinting.  A “fingerprint” is simply a mathematical rendering of the waveform of an audio file.)

There is a reference databases of recordings that are “known knowns” (which is why it is important to be included in the Content ID database as Maria Schneider correctly points out in her class action.)  The fingerprinting tool encounters a new file, takes a fingerprint, then looks for a match in the reference database and reports a result that triggers an action.  Typically, fingerprinting tools are binary:  match or no match.  What happens after the tool finds a match is entirely in the control of the operator.  (So while the tool could have a match rate of 90%, the operator could report a random number of matches or a fixed number of matches, like one every ten, or one every 1000.  That means 90% accuracy could turn into a much lesser percentage of reported matches.  It’s important to know how many matches trigger an action.)

Having had some experience with audio fingerprints, I think you will find that once a fingerprint is in the reference database, the recognition tool (Content ID in this case) will spot the reference fingerprint a very, very high percentage of the time.  The fingerprinting tool I’m most aware of caught matches over 90% of the time.  I can’t imagine that a tool developed by the biggest technology company in commercial history would do less–unless they wanted it to.  Remember, this is not taking into account re-records unless the re-record is itself in the database, or pitch bends.  This is an exact match which is very common use of Content ID.  (See Maria’s class action complaint, and Kerry Muzzey has a great description of this in his recent Senate testimony.)

If Content ID is actually missing matches to known knowns on the upload (assuming exact matching is possible), I find it very odd that Content ID is missing much.  Maybe it’s not, but one way to find out is to force Google to reveal the inner workings through discovery in the class action case.

But if Content ID does miss exact matches, it would be interesting to know what percentage of those misses end up being monetized, and of those, what percentage end up getting caught later by a subsequent use of Content ID or a manual investigative process.  This will give an idea of the scale of the retroactive payment issue.

As Maria rightly points out, it is virtually impossible for an artist or film maker without Content ID to catch YouTube monetizing infringing works.  But I think the analysis has to go a step further–even if you have Content ID, at the moment you catch YouTube monetizing illegal versions, you are in no different position than the artist who lacks access to the Content ID tool.

Both have the same problem–YouTube is profiting from illegal copies.  If when you catch them you then elect to monetize, YouTube will pay you going forward, i.e., prospectively.  But I do not believe they will pay you retroactivelyfor the illegal use.  (There is a rumor that some music publishers do get paid retroactively under some settlement, but that needs to be confirmed.)

That means that YouTube is directly profiting from piracy for the retroactive views which could total into the hundreds of millions per day given the massive number of daily views on YouTube.  If you elect to monetize due to YouTube’s monopoly power, you are essentially releasing them from liability under duress.  If you catch them.

So YouTube takes your property, monetizes it, and refuses to pay you for how much they made before you caught them if you ever do catch them.  They dare you to sue them because you would be taking on the biggest company in commercial history that controls 90% of the access to information in the world and routinely defies governments.  Not everyone has the spine of Maria Schneider.

Failing to license at all or failing to pay retroactively means that YouTube profits from piracy by converting your property to their own.  And as Maria rightly points out, Google scrapes user data through non-display uses in the background even if YouTube is not monetizing overtly which they then use to compile user profiles in “millions of buckets” (which dribbled out before Judge Koh in the Gmail litigation (In Re: Google, Inc. Gmail Litigation,  Case No. 13-MD-02430-LHK, (U.S.D.C. N.D. California, San Jose Division, Sept. 26, 2013)).

In either case, the value of the amount converted or stolen should rightly include the value of these user profiles scraped in the background, as well as the advertising revenue.

And don’t forget that Google is controlled by Larry Page, Sergei Brin, and Eric Schmidt through their “supervoting” shares of stock.  It’s hard to believe that this YouTube policy was created without their blessing.

The simplest move for Google would be to simply pay both retroactively and (if the copyright owner elects to monetize) prospectively.  Otherwise, it seems like a huge number of crimes are going on in a very planned and organized way dreamed up by YouTube and Google employees.  “Dreamed up” is also called a conspiracy, and if there’s an actual conspiracy it’s not a theory (which came up in an interesting trade secret misappropriation RICO case against Google they managed to wriggle out of, at least for the moment).

The law has another word for organized theft at scale–we sometimes call it “racketeering.”

racketeering


2019-2020 Streaming Price Bible : YouTube is STILL The #1 Problem To Solve

Here we go with the current year update.

This data set is isolated to the calendar year 2019 and represents a mid-sized indie label with an approximately 350+ album catalog now generating over 1.5b streams annually. Streaming is now a fully mature format, and it is also the number one source of revenue for recorded music. Streaming in all configurations now accounts for 64% of all recorded music revenues. Head on over to the RIAA US sales database [here] to check out the numbers. Pro Tip: Remember to adjust for inflation!

We are keeping a simplified chart again this year. We’ve extended to the top 30 streamers which represent 99.87% of all streaming dollars. The Top 10 streamers account for over 93% of all music streaming revenues (down from 97% last year). The Top 5 account for over 83% of all streaming dollars (down from 88% last year). The drop in overall revenues in the Top 5 and Top 10 are the result of YouTube’s Content ID pulling down the overall revenues / per stream.

The biggest takeaway by far is that YouTube’s Content ID, shows a whopping 51% of all streams generate only 6.4% of revenue. Read that again. This is your value gap. Over 50% of all music streams generate less than 7% of revenue.


This is the first time we have not seen the Spotify per stream rate drop since the service launched a decade ago. The Spotify per stream rate has stabilized moving up just slightly to .00348 from .00331.  In other words Spotify is paying out about $3,300 – $3,500 per million plays. We’re working with a very large sample that has aggregated all streams and revenue against both subscription and ad supported revenues for a single per stream average. This overall average is helpful for anyone who wants to calculate gross revenues by simply looking at the numbers on Spotify itself. For those who may not know, there is a simple “trick” to see the streams of any song on Spotify. On the desk top app, go to the album view and hover your mouse/cursor over the ||||||| at the far right side of any song, just to the right of the song length. Once there the plays for the song will materialize just below the song length.


Using our average, the song above has earned between $4,026 – $4,270.78 (gross before distribution fees) on Spotify at 1,220,224 plays.

Apple Music is again the best value per stream accounting for nearly 25% of all streaming revenue on only 6% of consumption. Spotify generates the most overall revenue of any streamer (no surprise) at 44% of all streaming revenue on 22% of consumption. As stated before, and which can not be overstated enough, You Tube’s Content ID is the major issue limiting growth contributing only 6% of revenues on over half of all streams, at 51% of total consumption. That’s a staggering statistic.

Apple’s per stream rate also stabilizes this year hitting a per stream rate of .0675 which is much closer to where it was two years ago at .00783. Our numbers from 2018 showed a dramatic drop in Apple’s rate at .00495 which we attribute to an expansion into new territories and a large number of 90 day free accounts that had not matured to fully paid subscribers.

In looking at the per stream rates for song and album equivalents, you might want to read this article by Billboard (as of 2018) on the current calculation of how many streams equal an album for the purposes of charting. The report states that, “The Billboard 200 will now include two tiers of on-demand audio streams. TIER 1: paid subscription audio streams (equating 1,250 streams to 1 album unit) and TIER 2: ad-supported audio streams (equating 3,750 streams to 1 album unit).” Our numbers suggest however it would be more fair to average all revenues, against all streams (including content ID), and that actually lands at about 3,516 streams per album across the board.


These numbers are from one set of confidentially supplied data for global sales. If you have access to other data sources that you can share, we’d love to see it.

  • HOW WE CALCULATED THE STREAMS PER SONG / ALBUM RATE:
  • As streaming services only pay master royalties (to labels) and not publishing, the publishing has to be deducted from the master share to arrive at the comparable cost per song/album.
  • $.99 Song is $.70 wholesale after 30% fee. Deduct 1 full stat mechanical at $.091 = $.609 per song.
  • Multiply the above by 10x’s and you get the album equivalent of $6.09 per album
[EDITORS NOTE: All of the data above is aggregated. In all cases the total amount of revenue is divided by the total number of the streams per service  (ex: $5,210 / 1,000,000 = .00521 per stream). In cases where there are multiple tiers and pricing structures (like Spotify), these are all summed together and divided to create an averaged, single rate per play.]

[royalties][streaming royalties][music royalties][royalty rates]

2018 Streaming Price Bible! Per Stream Rates Drop as Streaming Volume Grows. YouTube’s Value Gap is Very Real.

Here we go again. To see previous years, click [here].

This data set is isolated to the calendar year 2018 and represents a mid-sized indie label with an approximately 250+ album catalog now generating almost 1b streams annually. 2018 is the year we saw streaming truly mature as the dominant source of recorded music revenues.

In parsing the data provided we find that digital revenues are 86% of all recorded music revenues globally (RIAA Reports Digital Revenues as 90% of Total). Streaming is 80% (or more) of Digital Music Revenues. Downloads are about 20% of digital music revenues for the year, however if we isolate Q4, it would appear download revenues could be less than 15% of digital revenues. The transition from downloads to streaming is well beyond the tipping point and we wonder how long the major services (Apple, Amazon, Google) will continue to support the format.

As we dig down into the physical revenues much of the gross is eroded by manufacturing, shipping and inventory costs of both CDs and Vinyl. In short, the recorded music business is now the streaming music business. Whatever charm there is to vinyl, it is at best still a truly niche business in terms of meaningful net revenues.

Every year there are surprises in the data and this year is no exception. As always we present this data as a single sample, but one we feel is fairly representative of the state of the business. As such, we welcome comments from others with access to similar data to report on their findings. Some of the percentages may vary dependent upon the genre of music and the size of the label or artist. However, we generally don’t find trends that are completely contradictory to our sample where it matters most, in reporting on stream rates and relative marketshare.

We’ve also simplified the chart this year. Just one chart, and only the Top 20 streamers which represent  99.35% of all streaming dollars. The Top 10 streamers account for over 97% of all music streaming revenues. The Top 5 account for over 88% of all streaming dollars. What we see below is a maturing marketplace with a small number of dominant players. Anyone who thought the digital revolution would remove so called “gate keepers” are painfully wrong.

If you want to compare these numbers against the RIAA’s official report for the first half of 2018, click [here]. That data is for the USA and only through June of 2018. It’s hard to get “apples to apples” reporting, so everything should be taken as different perspectives on the overall business. If you are an artist or label, see how your own data compares.

The biggest takeaway by far is that YouTube’s Content ID, (in our first truly comprehensive data set) shows a whopping 48% of all streams generate only 7% of revenue. Read that again. This is your value gap. Nearly 50% of all recorded music streams only generate 7% of revenue.


The Spotify per stream rate drops again from .00397 to .00331 a decrease of 16%. Apple Music gains almost 3% for an total global marketshare of about just under 25% of all revenue.

Apple’s per stream rate drops from .00783 to .00495 a decrease of 36%. We need to state again, that 2018 saw a massive shift of revenues from downloads to streaming and no doubt this expansion of scale, combined with more aggressive bundling (free trials) as well as launching into more territories was bound to bring down the overall net per stream.

Apple Music still lead in the sweet spot with about 10% of overall streams generating 25% of all revenue (despite the per stream rate drop). Spotify by comparison has nearly triple the marketshare in streams than Apple Music but generates less than double the revenues on that volume.

The biggest takeaway by far is that YouTube’s Content ID, (in our first truly comprehensive data set) shows a whopping 48% of all streams and only 7% of revenue. Read that again. This is your value gap. Nearly 50% of all recorded music streams only generate 7% of revenue. Apple Music and Spotify combined account for just short of 40% of all streams and 74% of all revenue.

We don’t know how the powers that be at the major labels can continue to allow for this gross inequity. It will be interesting to see how YouTube Red numbers evolve over this year. YouTube Red, the newly rebranded version of the disastrous “Music Key” is off to a slow start in a competitive subscription music marketplace. One has to ask, what incentive is there really for Google/YouTube with the Red subscription service when they already benefit from service 48% of all streams while paying only 7% of the overall revenue?

In looking at the per stream rates for song and album, you might want to read this article by Billboard on the current calculation of how many streams equal and album for the purposes of charting. We don’t know if YouTube Content ID streams count towards charting, but they absolutely should not. The report states that, “The Billboard 200 will now include two tiers of on-demand audio streams. TIER 1: paid subscription audio streams (equating 1,250 streams to 1 album unit) and TIER 2: ad-supported audio streams (equating 3,750 streams to 1 album unit).”

In the coming year Amazon’s Unlimited Music service shows promise. We also wonder about Google Play. The payouts on Google Play are fair, but when bundled into the YouTube ecosystem is largely inconsequential in terms of both streams served and revenue. As smart home assistants grow there could be a larger market segment for paying subscribers to have streaming music catalogs available and on demand.


These numbers are from one set of confidentially supplied data for global sales. If you have access to other data sources that you can share, we’d love to see it.

  • HOW WE CALCULATED THE STREAMS PER SONG / ALBUM RATE:
  • As streaming services only pay master royalties (to labels) and not publishing, the publishing has to be deducted from the master share to arrive at the comparable cost per song/album.
  • $.99 Song is $.70 wholesale after 30% fee. Deduct 1 full stat mechanical at $.091 = $.609 per song.
  • Multiply the above by 10x’s and you get the album equivalent of $6.09 per album
[EDITORS NOTE: All of the data above is aggregated. In all cases the total amount of revenue is divided by the total number of the streams per service  (ex: $5,210 / 1,000,000 = .00521 per stream). In cases where there are multiple tiers and pricing structures (like Spotify), these are all summed together and divided to create an averaged, single rate per play.]

[royalties][streaming royalties][music royalties][royalty rates]

YouTube’s Value Gap is the Record Industry’s Biggest Problem To Fix, and Here’s Why…

If the record industry is serious about growing streaming revenues (and the digital economy in general) it must address the problems with the exploitative practices of Google’s YouTube. We’ve been lucky to be supplied with Content ID data from the same source as our previous data – so we added that into the mix to see where it would rank.

These numbers are just staggering.

If you combine Content ID to the YouTube Subscription numbers you arrive at a whopping 63% of total streaming market share that only contributes  11% of revenue. Ya’ll taking notes here?

yt_istheproblem


Look at the combined YouTube revenues of Subscriptions and Content ID together at 11% of revenue. That puts the combined earnings at #3 in market share behind Apple Music. However, Apple Music creates more earnings than the two combined YouTube Revenue streams with less than 4% of the consumption. You’ll also notice that YouTube is the only streaming service with three zeros following the decimal point. That means YouTube is paying hundreds of dollars per million streams while the other leading streamers are paying thousands.

Apple Music generates 12% of revenue with less than 4% of streams. YouTube generates 11% of revenue with 63% of streams. Does that sound like a problem to anyone else?

As of this writing we’re not factoring in the direct channel uploads for artists to YouTube or Vevo, however we just can’t imagine that those numbers are much different in terms of plays versus revenues. We hear from a lot of label folks that they are afraid to give up their annual revenue from YouTube sources, but all we can say is that you’d be gaining more much more than you would be giving up.

We’ve heard of at least one executive who met with resistance when faced with the prospect of potentially walking away from millions of dollars a year in YouTube revenues. But, it’s not walking away from millions, it’s giving up 10’s of millions in true revenue.

Let us not forget, that this devalued revenue will prevent the overall growth of streaming as a format. With streaming revenues (largely from Spotify and Apple Music) now accounting for approximately 40% of overall digital music revenues why should YouTube be able to pay 1/10th of the other major players? Oh, that’s right because of user pirated content uploads…

It’s time for the record business to get serious about cleaning up YouTube.