Future of Music Coalition Warns Against Vendor Lock-in in Copyright Office Comments

[The Future of Music Coalition joins the chorus of concern about shenanigans at The MLC, Inc. with special access and treatment of its vendors regarding the “public” database. As others have pointed out, there’s a real question as to whether The MLC, Inc. is actually building its own database or is just building up the data muscle of its vendor the Harry Fox Agency (formerly owned by MLC promoter and nonvoting board member NMPA. The MLC is prohibited by law from licensing other than the narrow window of streaming mechanicals, but HFA is not.]

[I]t’s important that MLC’s chosen vendors not be able to leverage their
status with the MLC to advantage themselves in other business activities not covered under the MMA. If a vendor was able to leverage its status with MLC to the detriment of competitors in other kinds of licensing activity (even informally), that wouldn’t serve competition, consumers, or creators. Additionally, the Office needs to ensure that provisions about database vendors being replaceable are meaningful.

We see no reason to expect that the MLC’s chosen vendors aren’t up to the task, but songwriters and composers need assurance that if a vendor ends up having problems and a change is necessary, that change will really be possible.

The Office can require the MLC to disclose what it is doing to prevent any vendor from being too operationally enmeshed with the MLC that it either enjoys an unfair advantage through that relationship, or that it would be practically impossible for another vendor to step in.

Read the entire post here.

2019-2020 Streaming Price Bible : YouTube is STILL The #1 Problem To Solve

Here we go with the current year update.

This data set is isolated to the calendar year 2019 and represents a mid-sized indie label with an approximately 350+ album catalog now generating over 1.5b streams annually. Streaming is now a fully mature format, and it is also the number one source of revenue for recorded music. Streaming in all configurations now accounts for 64% of all recorded music revenues. Head on over to the RIAA US sales database [here] to check out the numbers. Pro Tip: Remember to adjust for inflation!

We are keeping a simplified chart again this year. We’ve extended to the top 30 streamers which represent 99.87% of all streaming dollars. The Top 10 streamers account for over 93% of all music streaming revenues (down from 97% last year). The Top 5 account for over 83% of all streaming dollars (down from 88% last year). The drop in overall revenues in the Top 5 and Top 10 are the result of YouTube’s Content ID pulling down the overall revenues / per stream.

The biggest takeaway by far is that YouTube’s Content ID, shows a whopping 51% of all streams generate only 6.4% of revenue. Read that again. This is your value gap. Over 50% of all music streams generate less than 7% of revenue.


This is the first time we have not seen the Spotify per stream rate drop since the service launched a decade ago. The Spotify per stream rate has stabilized moving up just slightly to .00348 from .00331.  In other words Spotify is paying out about $3,300 – $3,500 per million plays. We’re working with a very large sample that has aggregated all streams and revenue against both subscription and ad supported revenues for a single per stream average. This overall average is helpful for anyone who wants to calculate gross revenues by simply looking at the numbers on Spotify itself. For those who may not know, there is a simple “trick” to see the streams of any song on Spotify. On the desk top app, go to the album view and hover your mouse/cursor over the ||||||| at the far right side of any song, just to the right of the song length. Once there the plays for the song will materialize just below the song length.


Using our average, the song above has earned between $4,026 – $4,270.78 (gross before distribution fees) on Spotify at 1,220,224 plays.

Apple Music is again the best value per stream accounting for nearly 25% of all streaming revenue on only 6% of consumption. Spotify generates the most overall revenue of any streamer (no surprise) at 44% of all streaming revenue on 22% of consumption. As stated before, and which can not be overstated enough, You Tube’s Content ID is the major issue limiting growth contributing only 6% of revenues on over half of all streams, at 51% of total consumption. That’s a staggering statistic.

Apple’s per stream rate also stabilizes this year hitting a per stream rate of .0675 which is much closer to where it was two years ago at .00783. Our numbers from 2018 showed a dramatic drop in Apple’s rate at .00495 which we attribute to an expansion into new territories and a large number of 90 day free accounts that had not matured to fully paid subscribers.

In looking at the per stream rates for song and album equivalents, you might want to read this article by Billboard (as of 2018) on the current calculation of how many streams equal an album for the purposes of charting. The report states that, “The Billboard 200 will now include two tiers of on-demand audio streams. TIER 1: paid subscription audio streams (equating 1,250 streams to 1 album unit) and TIER 2: ad-supported audio streams (equating 3,750 streams to 1 album unit).” Our numbers suggest however it would be more fair to average all revenues, against all streams (including content ID), and that actually lands at about 3,516 streams per album across the board.


These numbers are from one set of confidentially supplied data for global sales. If you have access to other data sources that you can share, we’d love to see it.

  • HOW WE CALCULATED THE STREAMS PER SONG / ALBUM RATE:
  • As streaming services only pay master royalties (to labels) and not publishing, the publishing has to be deducted from the master share to arrive at the comparable cost per song/album.
  • $.99 Song is $.70 wholesale after 30% fee. Deduct 1 full stat mechanical at $.091 = $.609 per song.
  • Multiply the above by 10x’s and you get the album equivalent of $6.09 per album
[EDITORS NOTE: All of the data above is aggregated. In all cases the total amount of revenue is divided by the total number of the streams per service  (ex: $5,210 / 1,000,000 = .00521 per stream). In cases where there are multiple tiers and pricing structures (like Spotify), these are all summed together and divided to create an averaged, single rate per play.]

[royalties][streaming royalties][music royalties][royalty rates]

No, Streaming Is Not Saving Us. Revenues still down by Half.

We’ve been hearing an alarming narrative that “record labels are making more money than ever from streaming, but they’re just not paying musicians”. To be clear, we certainly have our issues with major labels, however we also need facts and to be truthful.

The truth is, that a decade after losing half of it’s revenues due to piracy as reported by CNN (click here), record labels are now only getting back up to half of what the peak business was in 1999. Half of where we were in 1999, twenty years later. Let that sink in. As unpopular as he was twenty years ago, Lars Ulrich was right.

Twenty years later, and we’re still only half of where we were in 1999.

There are only three numbers that matter when looking at the record industry post-piracy and here they are:

1999 : $14.6b = $22.01 in 2018 Dollars
2009 : $6.3b = $7.37 in 2018 Dollars
2018 : $9.8b = $9.8b in 2018 Dollars

This is clearly illustrated in the chart below provided by the RIAA, the trade group responsible for tracking these figures. At their lowest point in 2014, revenues from record sales were less than one third of their peak.

What this chart also shows is a decade long loss of $10b or more annually, which is over $100b in lost revenues to labels and artists. That’s $100b in lost revenues to labels and artists in just the past decade.

If we track total lost revenue to labels and artists since the launch of Napster in 1999 it totals just under $200 Billion Dollars in the USA alone.

The fundamental problem remains the same. There’s a hole in our bucket and all that revenue falling out though the bottom leads more or less to advertising funded piracy and YouTube. Many have suggested that YouTube is effectively the largest ad supported piracy platform. As we reported earlier this year in our updated Streaming Price Bible, the YouTube Value Gap is very, very real.

In future posts we’ll offer solutions and suggestions that should be under consideration at every major label. Not the least of which is transitioning subscription streaming models to incorporate a per stream transactional baseline, or a minimum wholesale price per stream.

In streaming, consumption does not grow revenues. More consumption and more streams do not generate more money. Revenue can only be generated by charging more for subscriptions, generating more advertising revenue (ad supported only, obviously) and expanding into more markets (gaining new subscribers). But eventually, everything flattens.

So the biggest question remains. What happens to overall revenues as streaming matures and cannibalizes the remaining revenue sources into purely niche markets. Digital Downloads will account for less than 10% of recorded music revenues by the end of the year, if not already. The CD market continues drop, and vinyl also declined slightly from 2017 (4.4%) to 2018 (4.3%).

Will streaming compensate for the lost revenues in other formats and continue to grow revenues towards a true recovery? It’s possible, but there will have to be some changes to address the economics presented to consumers despite what Goldman Sachs says. For the year of 2018 the industry reported $9.8b in revenues. To make that $37.2b by 2030 the industry needs to add nearly $3b a year for the next 10 years!

We don’t know what else they’ve got in that crystal ball that can predict revenues over a decade into the future but even by their bullish estimate of $37.2b in 2030, that is only $28b in 2019 dollars. Right now we’re still about $20b short.


2018 Streaming Price Bible! Per Stream Rates Drop as Streaming Volume Grows. YouTube’s Value Gap is Very Real.

Here we go again. To see previous years, click [here].

This data set is isolated to the calendar year 2018 and represents a mid-sized indie label with an approximately 250+ album catalog now generating almost 1b streams annually. 2018 is the year we saw streaming truly mature as the dominant source of recorded music revenues.

In parsing the data provided we find that digital revenues are 86% of all recorded music revenues globally (RIAA Reports Digital Revenues as 90% of Total). Streaming is 80% (or more) of Digital Music Revenues. Downloads are about 20% of digital music revenues for the year, however if we isolate Q4, it would appear download revenues could be less than 15% of digital revenues. The transition from downloads to streaming is well beyond the tipping point and we wonder how long the major services (Apple, Amazon, Google) will continue to support the format.

As we dig down into the physical revenues much of the gross is eroded by manufacturing, shipping and inventory costs of both CDs and Vinyl. In short, the recorded music business is now the streaming music business. Whatever charm there is to vinyl, it is at best still a truly niche business in terms of meaningful net revenues.

Every year there are surprises in the data and this year is no exception. As always we present this data as a single sample, but one we feel is fairly representative of the state of the business. As such, we welcome comments from others with access to similar data to report on their findings. Some of the percentages may vary dependent upon the genre of music and the size of the label or artist. However, we generally don’t find trends that are completely contradictory to our sample where it matters most, in reporting on stream rates and relative marketshare.

We’ve also simplified the chart this year. Just one chart, and only the Top 20 streamers which represent  99.35% of all streaming dollars. The Top 10 streamers account for over 97% of all music streaming revenues. The Top 5 account for over 88% of all streaming dollars. What we see below is a maturing marketplace with a small number of dominant players. Anyone who thought the digital revolution would remove so called “gate keepers” are painfully wrong.

If you want to compare these numbers against the RIAA’s official report for the first half of 2018, click [here]. That data is for the USA and only through June of 2018. It’s hard to get “apples to apples” reporting, so everything should be taken as different perspectives on the overall business. If you are an artist or label, see how your own data compares.

The biggest takeaway by far is that YouTube’s Content ID, (in our first truly comprehensive data set) shows a whopping 48% of all streams generate only 7% of revenue. Read that again. This is your value gap. Nearly 50% of all recorded music streams only generate 7% of revenue.


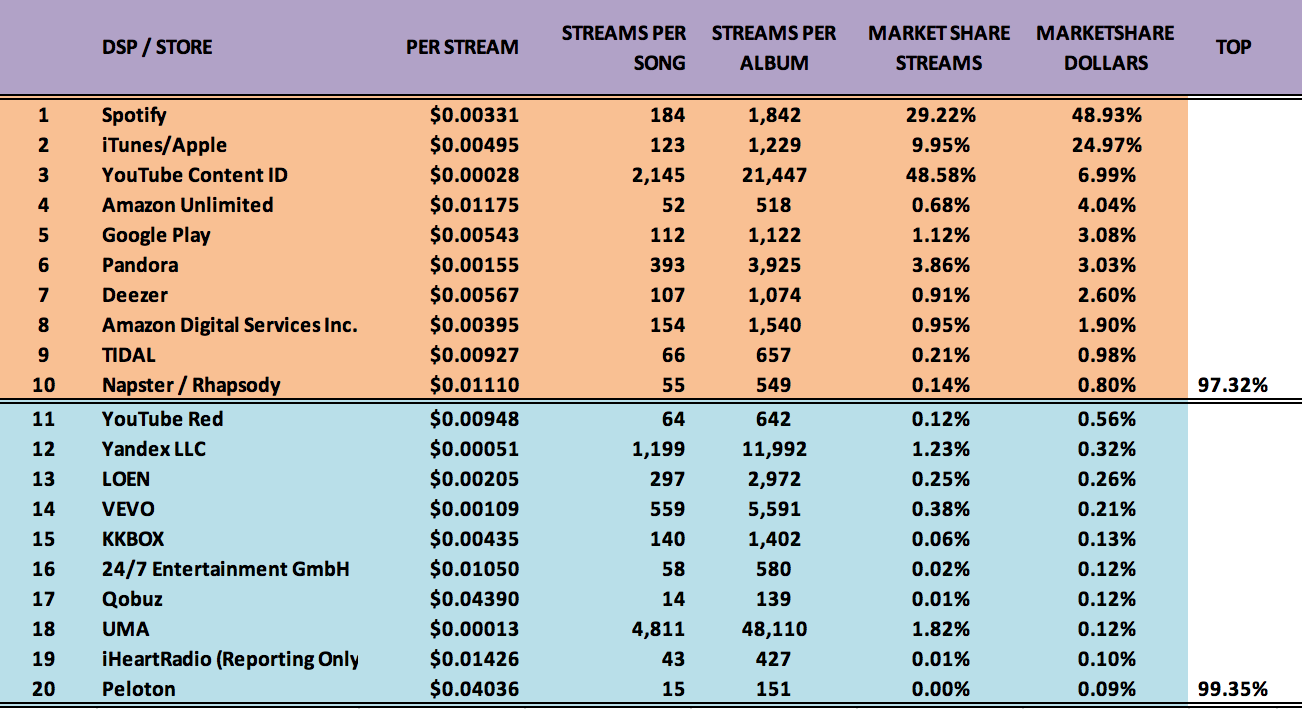
The Spotify per stream rate drops again from .00397 to .00331 a decrease of 16%. Apple Music gains almost 3% for an total global marketshare of about just under 25% of all revenue.

Apple’s per stream rate drops from .00783 to .00495 a decrease of 36%. We need to state again, that 2018 saw a massive shift of revenues from downloads to streaming and no doubt this expansion of scale, combined with more aggressive bundling (free trials) as well as launching into more territories was bound to bring down the overall net per stream.

Apple Music still lead in the sweet spot with about 10% of overall streams generating 25% of all revenue (despite the per stream rate drop). Spotify by comparison has nearly triple the marketshare in streams than Apple Music but generates less than double the revenues on that volume.

The biggest takeaway by far is that YouTube’s Content ID, (in our first truly comprehensive data set) shows a whopping 48% of all streams and only 7% of revenue. Read that again. This is your value gap. Nearly 50% of all recorded music streams only generate 7% of revenue. Apple Music and Spotify combined account for just short of 40% of all streams and 74% of all revenue.

We don’t know how the powers that be at the major labels can continue to allow for this gross inequity. It will be interesting to see how YouTube Red numbers evolve over this year. YouTube Red, the newly rebranded version of the disastrous “Music Key” is off to a slow start in a competitive subscription music marketplace. One has to ask, what incentive is there really for Google/YouTube with the Red subscription service when they already benefit from service 48% of all streams while paying only 7% of the overall revenue?

In looking at the per stream rates for song and album, you might want to read this article by Billboard on the current calculation of how many streams equal and album for the purposes of charting. We don’t know if YouTube Content ID streams count towards charting, but they absolutely should not. The report states that, “The Billboard 200 will now include two tiers of on-demand audio streams. TIER 1: paid subscription audio streams (equating 1,250 streams to 1 album unit) and TIER 2: ad-supported audio streams (equating 3,750 streams to 1 album unit).”

In the coming year Amazon’s Unlimited Music service shows promise. We also wonder about Google Play. The payouts on Google Play are fair, but when bundled into the YouTube ecosystem is largely inconsequential in terms of both streams served and revenue. As smart home assistants grow there could be a larger market segment for paying subscribers to have streaming music catalogs available and on demand.


These numbers are from one set of confidentially supplied data for global sales. If you have access to other data sources that you can share, we’d love to see it.

  • HOW WE CALCULATED THE STREAMS PER SONG / ALBUM RATE:
  • As streaming services only pay master royalties (to labels) and not publishing, the publishing has to be deducted from the master share to arrive at the comparable cost per song/album.
  • $.99 Song is $.70 wholesale after 30% fee. Deduct 1 full stat mechanical at $.091 = $.609 per song.
  • Multiply the above by 10x’s and you get the album equivalent of $6.09 per album
[EDITORS NOTE: All of the data above is aggregated. In all cases the total amount of revenue is divided by the total number of the streams per service  (ex: $5,210 / 1,000,000 = .00521 per stream). In cases where there are multiple tiers and pricing structures (like Spotify), these are all summed together and divided to create an averaged, single rate per play.]

[royalties][streaming royalties][music royalties][royalty rates]

Spotify’s Big Lie, Streaming Habits Mirror Purchasing Habits

One of the biggest lies told by Spotify is that streaming will provide more revenue over the life of a record because every play will be monetized. This as opposed to the one time payment earned from a transactional purchase where all the revenue from the purchase of the record is paid at once. There is however, a very big problem with this theory, which is that the consumption curves of streaming match the consumption curves of transactional sales.

So, what about that so called long tail? Well, it doesn’t exist. Not for music consumption. Or we should say, it doesn’t exist any different for streaming than it did has for transactional sales. What do you think is more profitable in generating revenue? Is it the album sales of artists catalogs, or is streams?

Keep in mind, streaming is a fixed cap market. So it does not matter how much the market grows in actual consumption, the revenue is capped by the amount of revenue earned by the hosting provider. If consumption doubles, but revenues stay flat, every stream is worth half of what it was previously.

We’re already seeing this trend as we noted earlier this year that Spotify per stream rates appear to be dropping steadily by about 8% per year. This is likely a combination of both the growth of consumption and the slowing of revenue across both subscriptions and advertising.

If anyone truly believes streaming is going to generate more revenues than transactional sales, we have a bridge in Brooklyn to sell you cheap. The fix is simple. The industry must move towards adopting an industry standard streaming penny rates. Only by setting fixed per stream rates will compensation scale with consumption.

[NOTE:] Chart from a mid size indie label showing revenues from Downloads and Streaming. The Spikes indicate new release activity / hits which reveals that revenue tails off for streaming the same way it does for transactional downloads.

How Spotify (and others) Could Have Avoided Songwriter Lawsuits, Ask The Labels.

This is simply a story about intent. Daniel Ek is the co-founder of Spotify, he was also the CEO of u-torrent, the worlds most successful bit-torrent client. As far we know u-torrent has never secured music licenses or paid any royalties to any artists, ever.

Spotify could have completely avoided it’s legal issues around paying songwriters.  The company could have sought to obtain the most recent information about the publishing and songwriters for every track at the service.  The record labels providing the master recordings to Spotify are required to have this information. All Spotify (and others) had to do, was ask for it.

Here’s how it works.

For decades publishers and songwriters have been paid their share of record sales (known as “mechanicals”) by the record labels in the United States. This is a system whereby the labels collect the money from retailers and pay the publishers/songwriters their share. It has worked pretty well for decades and has not required a industry wide, central master database (public or private) to administer these licenses or make the appropriate payments.

This system has worked because each label is responsible for paying the publishers and songwriters attached to the master recordings the label is monetizing. The labels are responsible for making sure all of the publishers and writers are paid. If you are a writer or publisher and you haven’t been paid, you know where the money is – it is at the record label.

Streaming services pay the “mechanicals” at source which are determined by different formulas and rules based upon the use. For example non-interactive streaming and web radio (simulcasts and Pandora) are calculated and paid via the appropriate performing rights society like ASCAP or BMI. These publishing royalties are treated more like radio royalties.

The “mechanicals” for album sales from interactive streaming services are calculated in a different way. It is the responsibility of the streaming services to pay these royalties. CDBaby explains the system here and here. Don’t mind that these explanations are an attempt to sell musicians more CDBaby services, just focus on the information provided for a better understanding of this issue.

Every physical album and transactional download (itunes and the like) pays the “mechanical” publishing to the record label directly, who then pays the publishers and writers.  This publishing information exists as labels providing the master recordings to Spotify have this information. All Spotify (and others) have to do, is ask for it.

Record labels have collectively and effectively “crowd sourced” licensing and payments to publishers and songwriters for decades. Why can’t Spotify simply require this information from labels, when the labels deliver their masters? It’s just that simple. Period.

The simple, easy, and transparent solution to Spotify’s licensing crisis is to require record labels to provide the mechanical license information on every song delivered to Spotify. The labels already have this information.

The simple solution is for Spotify to withdraw any and all songs from the service until the label who has delivered the master recording also delivers the corresponding publisher and writer information for proper licensing and payments. Problem solved!

No need for additional databases or imagined licensing problems. Every master recording on Spotify is delivered by a record label. Every record label is required by law to pay the publishers and songwriters. This is known and readily available information by the people who are delivering the recordings to Spotify!

There is no missing information, and no unknown licenses. Why is this so F’ing hard?

This system would mean that the record labels would have to provide this information. It’s also possible that some of that information is not accurate. Labels would probably fight against any mechanism that would make them have to make any claims about the accuracy of their data, which is fine. If it’s the most update information it’s a great place to start.

Of course, we know that both sides (both labels and streamers) will reject any mechanism that introduces friction into the delivery of masters. However, with the simple intent of requiring publisher and songwriter info for every song master delivered there will no longer be a problem at the scale that currently exists.

To be completely fair to Spotify they did work to make deals with the largest organizations representing publishers and songwriters (NMPA and HFA). However those two organizations leave out a lot of participants. So back to square one. If publishing information is required upon the delivery of masters, the problem is largely solved. Invoking a variation on Occam’s Razor, the best solution is usually the most simple one.

You’d think that in the times before computers this would have been harder than it is now, but like all things Spotify you have to question the motivations of a company whose founder created the most successful bittorrent client of all time, u-torrent.

Oh, and of this writing Spotify is now claiming they have no responsibility to pay any “mechanicals” at all. Can’t make this up.


The 21st Century Marketing Restriction: No licensing for Artificial Intelligence — Artist Rights Watch

If you let your record company license your recording for AI algorithmic music a la Orwell’s “versificator”, it’s like Silicon Valley making you train your replacement.

By Chris Castle

After the money, one of the most important parts of a recording artist negotiation is the “marketing restrictions”.  These are restrictions on what the record company or music publisher can do with your work–what type of licenses they can, or more frequently cannot, grant to third parties, for example.  Essentially, whatever is not prohibited is permitted.

Marketing restrictions also have a temporal element–during or after the term, recouped or not recouped.  There are some restrictions that are acknowledged to be verboten and are usually easy and unrestricted concessions.  An example of these would be licensing for certain types of commercials such as tobacco, firearms, grooming or hygiene products and alcohol.

Stewart Dredge has an excellent article this week in the Guardian which brings to mind Laura Kobylecky‘s post on MusicTechPolicy drawing comparisons between Spotify’s “fake artist” problem and “The Next Rembrandt” with echoes of the fictional  “versificator” operated by Big Brother’s “Music Department” in 1984.  According to Stewart, there are dozens of AI music startups getting funded that all essentially do the same thing.  Using a library of recordings (sometimes called a “corpus”), the algorithms “create” new recordings based on the songs and recordings in the corpus.  Google is, of course, a leader in the space (not that different from how they used Google Books to train their translation algorithm, a process called “corpus machine translation”–the librarians will be next).

Those recordings can then be sold or licensed at a very low price which, as Laura and others have noted, can be used to drive down the royalties payable to all other artists on digital music services.

This is, of course, not dissimilar to Silicon Valley companies hiring lower paid foreign workers and ordering the employees who they are to replace participate in training their replacements.  The difference is, of course, that those recordings have to come from somewhere.

It’s time to start adding to the list of marketing restrictions that the song or recording cannot be licensed for AI purposes of any kind.

via The 21st Century Marketing Restriction: No licensing for AI — Artist Rights Watch

If Only Artists and Managers Had Listened To Us : Spotify Per Stream Rates Keep Dropping

We hate to say we told ya so, but… Below is our post from September 2015. Two years ago we predicted the inevitable truth of the all you can eat Spotify subcription model. Like many of our predictions and proposals (example; windowing titles) we’ve had to wait for the industry to catch up to us. Today, two years later, Digital Music News confirms our prediction.

Read the report from Digital Music News by clicking the headline link here.

Exclusive Report: Spotify Artist Payments Are Declining In 2017, Data Shows | Digital Music News

Our original post from 2015 is below…


Spotify Per Play Rates Continue to Drop (.00408) … More Free Users = Less Money Per Stream #gettherateright

Down, down, down it goes, where it stops nobody knows… The monthly average rate per play on Spotify is currently .00408 for master rights holders.

PerStreamAvg_Jun11_July15

48 Months of Spotify Streaming Rates from Jun 2011 thru May 2015 on an indie label catalog of over 1,500 songs with over 10m plays.

Spotify rates per spin appear to have peaked and are now on a steady decline over time.

Per stream rates are dropping because the amount of revenue is not keeping pace with the  number of streams. There are several possible causes:

1) Advertising rates are falling as more “supply” (the number of streams) come on line and the market saturates.

2) The proportion of  lower paying “free streams”  is growing faster than the proportion of higher paying “paid streams.”

3) All of the above.

This confirms our long held suspicion that as a flat price “freemium” subscription service  scales the price per stream will drop.  As the service reaches “scale” the pool of streaming revenue becomes a fixed amount.  The pie can’t get any larger and adding more streams only cuts the pie into smaller pieces!

The data above is aggregated. In all cases the total amount of revenue is divided by the total number of the streams per service  (ex: $4,080 / 1,000,000 = .00408 per stream). Multiple tiers and pricing structures are all summed together and divided to create an averaged, single rate per play.

Labels / Spotify Admit Windowing is Streaming Solution (while cutting royalty rates)

It’s amazing how long it takes the industry to catch up to us. We strongly suggested windows and pay-gates at ad supported streaming services (Spotify) to drive conversion rates to subscription revenues back in 2014 and again in 2015, twice!

Well guess what is being reported in Digital Music News this week…

“According to details tipped, the Swedish streamer would restrict the biggest album releases to only paid subscribers for a period of time.”

Wow, windowing works! Who knew?!

But here’s the real kicker, the labels are LOWERING royalty rates in exchange for the ability to window hit records! It’s unbelievable that the industry must always take two steps back for every one step forward. Does it really need to be this hard?

Read the full story at Digital Music News below:

Spotify Finally Finds a Way to Lower Licensing Deals and Go Public


After 16% drop in Per Stream rates, Spotify asks for another 14% Reduction…

We can’t make this up. We’ve stated many times before, as the consumption of streams increase (and those services grow) the per stream rate will drop as revenues level off. This is simply because revenues can not keep up with consumption, and there is no fixed per stream rate.

In our latest look at streaming rates we found that Spotify streaming rates had dropped 16% from 2014 to 2016. Now, Hypebot is reporting that Spotify is asking for another 14% reduction in royalty payments.

Please someone break out a calculator… that would be a 30% reduction in per stream rates in two years! It’s just math. Wow.

Read the full story at Hypebot:

Spotify’s Latest Offer To Labels: A 14% Lower Royalty Rate | Hypebot