Just an FYI for all you Trichordist readers. Yours truly will be performing at the Creative Upstarts Make Your Mark Party. Hope to see
If you want to come RSVP here.
Just an FYI for all you Trichordist readers. Yours truly will be performing at the Creative Upstarts Make Your Mark Party. Hope to see
If you want to come RSVP here.
You think Performers have it bad with streaming/webcasting services? Check out my performance royalties as a songwriter. This is why we must end the Government mandates that force us to license our songs to these services at below market rates. It’s a subsidy to multi-billion dollar Silicon Valley companies.
This is all songwriters on the song. Not just my share. My share is 1/5-1/2 of this total. varies by song.
This is total that all the songwriters earned on my 200+ published songs. If streaming is the future? It does not include professional songwriters. This can not stand.
| Summary | Spins | $ | Per Spin in Cents!!! |
| YouTube | 551,275 | $30.57 | 0.00555 |
| Pandora | 1,499,396 | $67.20 | 0.00448 |
| Spotify | 400,955 | $113.92 | 0.02841 |
| Rhapsody | 61,235 | $30.14 | 0.04923 |
| All other internet services | 1,000,915 | $15.96 | 0.00159 |
Thursday, March 13 | 3:30PM – 4:30PM
Austin Convention Center | Room 12AB | 500 E Cesar Chavez Sthttp://schedule.sxsw.com/2014/events/event_MP990775
Business gets harder and harder for recording artists and songwriters. Problems have developed with labels, publishers, fans, online distribution services like Spotify, major ISPs like Google, and Internet radio networks like Pandora. They also endure antagonistic courts, ineffective laws, and government indifference. As a result, their property interest has been significantly devalued and their rights abridged. Recently some recording artists and songwriters have started to criticize and push back against this new status quo.
MODERATOR
Jay Rosenthal
SVP & General Counsel – National Music Publishers’ AssociationEric Hilton
Thievery CorporationDavid Zierler
Pres – INgroovesLee Miller
Pres – Nashville Songwriters Association InternationalDavid Lowery
Musician/Internet Content Provider – Cracker
Is this the future of music? We continue to explore artist revenue streams.
Here’s what 1 million streams looks like from different revenue perspectives on the two largest and mainstream streaming services.
| Service | Units | Per Unit | Total | Notes |
| Spotify | 1,000,000 | $0.00521 | $5,210.00 | Gross Payable to Master Rights Holder Only |
| Spotify | same million units as above | $0.00052 | $521.00 | Gross Payable to Songwriter/s & Publisher/s (est) |
| YouTube | 1,000,000 | $0.00175 | $1,750.00 | Gross Payable for All Rights Video, Master & Publishing |
| YouTube CMS Master Recording (Audiam / AdRev) | 1,000,000 | $0.00032 | $321.00 | Gross Payable to Master Rights Holder Only |
| STREAMING TOTALS | 3,000,000 | $7,802.00 | TOTAL REVENUE EARNED FOR 3 MILLION PLAYS ON SPOTIFY AND YOUTUBE | |
| Itunes Album Downloads | 1,125 | $7.00000 | $7,875.00 | Gross payable including Publishing |
Here are some compelling stats on the break down of what percentage of videos on YouTube actually achieve breaking the 1 million play threshold, only 0.33%
CHART OF THE DAY: Half Of YouTube Videos Get Fewer Than 500 Views | Business Insider
Some 53% of YouTube’s videos have fewer than 500 views, says TubeMogul. About 30% have less than 100 views. Meanwhile, just 0.33% have more than 1 million views.
That’s not a huge surprise. But it highlights some of the struggles Google could have selling ads around all those unpopular videos, despite the money it has to spend to store them.
An artist needs to generate THREE MILLION PLAYS on the two largest and most popular streaming platforms to equal just 1,125 album downloads from Itunes. This is an important metric to put in context. In 2013 only 4.8% of new album releases sold 2,000 units or more. So if only 4.8% of artists can sell 2,000 units or more, how many artists can realistically generate over four million streams from the same album of material?
in 2013 there were 66,565 new releases, only 3,237 sold more than 2,000 units = 4.8% of new releases sold over 2,000 units
in 2013 there were 915,482 total releases in print, only 14,856 sold more than 2,000 units = 1.6% of ALL RELEASES in print sold more than 2,000 units.
This is even more important when you start to consider that many artists feel that growing a fan base of just 10,000 fans is enough to sustain a professional career. Note we said solo artists because these economics probably need to be multiplied by each band member added for the revenue distribution to remain sustainable. So a band of four people probably need a sales base of 40,000 fans to sustain a professional career for each member of the band.
Each 10,000 albums sold on iTunes (or 100,000 song downloads) generates $70,000 in revenue for the solo artist or band. To achieve the same revenue per 10,000 fans in streams, the band has to generate 30 million streaming plays (as detailed above) if they are distributing their music across the most common streaming services including Spotify and YouTube.
In 2013 the top 1% of new releases (which happen to be those 620 titles selling 20k units or more) totaled over 77% of the new release market share leaving the remaining 99% of new releases to divide up the remaining 23% of sales.
This appears to confirm our suspicion that the internet has not created a new middle class of empowered, independent and DIY artists but sadly has sentenced them to be hobbyists and non-professionals.
Meanwhile the major artists with substantial label backing dominate greater market share as they are the few who can sustain the attrition of a marketplace where illegally free and consequence free access to music remains the primary source of consumption.
What’s worse is that it is Silicon Valley corporate interests and Fortune 500 companies that are exploiting artists and musicians worse than labels ever did. New boss, worse than the old boss, indeed.
So whose feeling empowered?
Is this the future of music? We continue to look at artist revenue streams.
Now that we’ve been blessed with a few data sets we’re going to be digging deeper into cross referencing them in the hopes of building a much better overall view of the marketplace for independent musicians. This is especially true in the area of music streaming rates and royalties.
We hoping to provide as much open and transparent information as we can get on artists revenue streams. Through the release of these posts offering per play rates, relative market share of these companies, and the distribution tiers at different unit thresholds we hope artists will use these tools to model a better understanding of their revenue potential on digital platforms.
| Service | Market Share Streams | Market Share $$$ |
| Spotify | 61% | 69% |
| YouTube* | 32% | 12% |
| Deezer | 2% | 4% |
| Amazon Cloud | 2% | 0% |
| Rhapsody | 1% | 3% |
| Muve Music | 1% | 1% |
| Rdio | 0% | 1% |
| Xbox Music | 0% | 2% |
| MediaNet | 0% | 1% |
| Google Play | 0% | 2% |
| Nokia | 0% | 0% |
| simfy | 0% | 0% |
| MySpace Music | 0% | 0% |
| Amazon MP3 | 0% | 5% |
| eMusic | 0% | 1% |
| VerveLife | 0% | 0% |
| TOTAL | 100% | 100% |
* These YouTube numbers are not directly comparable to the rest of the numbers as the information comes from a different data set of considerably less titles than the larger data set.
That being said there are still a few important take-a-ways in looking at this data even on a percentage of market share basis. If we doubled the amount of YouTube Streams to match the amount of Spotify streams (48% YouTube Streams and 47% Spotify Streams) the revenue disparity still places Spotify 3x’s higher at 62% of overall revenue market share versus YouTube’s only 21% of market share revenue. Simply said, you have to stream at least 3x’s more on YouTube to equal the same amount of revenue generated from YouTube.
| Service | Market Share Streams | Market Share $$$ |
| YouTube (x’s2) | 48% | 21% |
| Spotify | 47% | 62% |
| Deezer | 2% | 3% |
| Amazon Cloud | 1% | 0% |
| Rhapsody | 1% | 2% |
| Muve Music | 0% | 1% |
| Rdio | 0% | 1% |
| Xbox Music | 0% | 2% |
| MediaNet | 0% | 1% |
| Google Play | 0% | 2% |
| Nokia | 0% | 0% |
| simfy | 0% | 0% |
| MySpace Music | 0% | 0% |
| Amazon MP3 | 0% | 4% |
| eMusic | 0% | 1% |
| VerveLife | 0% | 0% |
| TOTAL | 100% | 100% |
Our conclusion is that this is a very compelling reason to remove as much of your music from YouTube as you possibly can and redirect streaming music consumers to Spotify where you will earn at least 3x’s more for the same amount of streams.
Of course, creators and musicians are not given this type of consent over the use of their music on YouTube and the new CMS Services like Audiam exist only to monetize illegal and unlicensed user generated content (UGC) uploads to YouTube, and at significantly lower per play rates than the ones we’ve been tracking that pay 100% of earned revenue.
This just confirms what we’ve known all along. Google not only profits greatly from the illegal and unlicensed uploads of an artists work to YouTube, but artists are more and more powerless over having their work exploited against their will.
Here are some compelling stats on the break down of what percentage of videos on YouTube actually achieve breaking the 1 million play threshold, only 0.33%
CHART OF THE DAY: Half Of YouTube Videos Get Fewer Than 500 Views | Business Insider
Some 53% of YouTube’s videos have fewer than 500 views, says TubeMogul. About 30% have less than 100 views. Meanwhile, just 0.33% have more than 1 million views.
That’s not a huge surprise. But it highlights some of the struggles Google could have selling ads around all those unpopular videos, despite the money it has to spend to store them.
Why does this just feel like just so much more extortion and exploitation?
Only one third of one percent of all videos uploaded to YouTube generate 1m or more views. Tell us again about this internet empowerment…
Half Of YouTube Videos Get Fewer Than 500 Views | Business Insider
YouTube’s most-watched-video lists are full of viral hits and popular music videos. But the majority of videos uploaded to Google’s (GOOG) video site are hardly watched by anyone.
Some 53% of YouTube’s videos have fewer than 500 views, says TubeMogul. About 30% have less than 100 views. Meanwhile, just 0.33% have more than 1 million views.
And here’s another interesting stat, music is the #1 category accounting for over 30% of all views.
Inside YouTube Videos : Exploring YouTube videos and their use in blogosphere | Sysomos
Main highlights:
Music is the most popular category with 31% of all analyzed videos, followed by Entertainment (15%) and People & Blogs (11%).
There is no clear correlation between the rating of the video on YouTube and how often it is viewed. Videos with a rating more than 4 out of 5 usually have fewer views than those with medium rating score between 2 to 3.
Average length of a YouTube video is 4 minutes and 12 seconds.
The average number of views for the YouTube videos we analyzed is 99,160.
If there is an authoritative source of more current stats than these please let us know in the comments.

Medianet Statement reporting Beats and MOG plays.
This is the first of a series of posts in which I will highlight what appears to be statistical anomalies in the reporting of streaming and webcasting income to songwriters and performers.
Here is my songwriter statement from Medianet for plays on the Beats/MOG streaming service for Jan 2014. Yes MEDIANET the same company that Aimee Mann successfully sued for distributing her songs without permission. Now for the moment I’m not going to focus on whether Medianet is properly involved in this transaction. No I don’t have a direct deal with this company however they could have been hired by the streaming service(s) to pay royalties. Another possibility is the company may be involved by requesting a compulsory license (although I can’t find in my records a legally required NOI from the company!)
For right now I just want to point out that the plays Medianet and/or Beats are reporting are statistically unlikely. Very Unlikely.
This statement purports that the ONLY TWO songs that were streamed were two songs from Camper Van Beethoven’s 2013 album La Costa Perdida.
Come Down the Coast is reported to have been spun a total of 24 times.
You’ve got to Roll is reported to have been spun a total of 380 times.
If you know anything about the Camper Van Beethoven oeuvre these are not like our…er… um… biggest hits? Sure Pictures of Matchstick Men is a cover of a Status Quo song so that wouldn’t be on my statement and Take The Skinheads Bowling is administered by Wixen so I don’t get the statement directly. So I can’t compare this to my two biggest singles. But even without knowing the spins on those two singles these reported plays seem unlikely. There are many many more singles and fan favorites that have historically garnered many spins.
Digging deeper, Come Down The Cost and You’ve Got To Roll weren’t singles, licensed for commercials, placed in soundtracks, they were likely to be listened to in album sequence. As a result if you look at any songwriters catalog you will see that track 1 (in this case Come Down the Coast) is always spun more often than track 3 (in this case You Got To Roll). Further all my other statements from this time period do not show You Got To Roll being spun more than Come Down the Coast.
Finally it’s highly unlikely that these were the only two Camper Van Beethoven Music songs spun on the service.
This leaves us with 3 possible outcomes.
1. The statement is correct and there has been a drastic change in the popularity of Camper Van Beethoven tracks after 30+ years.
2. Beats Music and/or Medianet are not properly tracking on demand spins.
3. Beats Music and/or Medianet are just making up these statements out of thin air.
I’m not a lawyer but as a civilian it seems the last two possibilities imply varying degrees of fraud.
I encourage other songwriters to examine their statements from Medianet, Beats (also their wholly owned subsidiary MOG). If other songwriters are seeing these same anomalies we need to do something about this.
Also I call upon Beats “Artists Advocate” Dave Allen and CEO Ian Rogers to publicly explain what Beats reported to Medianet? After all Beats music promised to share their data with artists!
So why don’t I audit these companies? Well? Funny story.
As a songwriter the US Government bars me from auditing these streaming companies if they requested a compulsory license. Read that again. The US Government gives these Corporations a right to use my songs without asking my permission but as an individual I am barred from auditing them! So even if they are making this shit up I have no way of finding out. Chilling.
Is this the future of music? We continue to look at artist revenue streams.
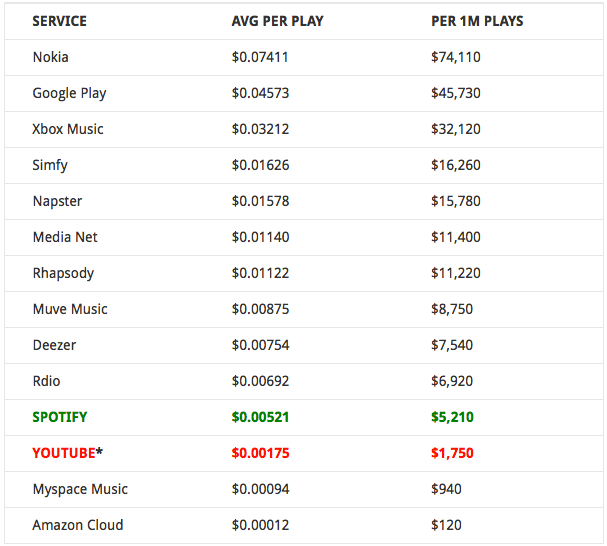
If you’re heading out to any panels at SXSW this week, you might want to keep this handy when you’re being told how much money you can make… And if the services at the top of the list like Nokia, Google Play and Xbox Music can pay more per play, why can’t the services at the bottom of the list like Spotify and YouTube?
We’ll give you a hint, the less streams/plays there are the more each play pays. The more plays there are the less each stream/play pays. Tell us again about how these services will scale. Looking at this data it seems pretty clear that the larger the service get’s, the less artists are paid per stream.
So do you think streaming royalty rates are really going to increase as these services “scale”? No, we didn’t either.
* YouTube payment includes gross payable to single party uploader claiming 100% of rights including video, master and publishers. There should also be additional PRO money earned however we haven’t been able to get any reporting to date.Our YouTube pay rate calculations can be found here:What YouTube Really Pays… Makes Spotify Look Good!
This week congress will hear testimony on the DMCA as part of it’s on going review of the Copyright Act.
Here’s 10 essential posts and articles to read to understand the Digital Millennium Copyright Act (DMCA).
Google Receives Its 100 Millionth Piracy Notice. Nothing Changes… | DMN
Is this really what Congress had in mind when it created the DMCA? | Vox Indie
The DMCA is not an Alibi: The Googlization of Art and Artists | MTP
The DMCA is Broken… | Trichordist
How DMCA Abuse Hurts Content Creators | Vox Indie
Copyright Erosion: How DMCA Misuse Became A Multimillion Dollar Shakedown and Income Transfer | MTP
Is it Time to Repair the DMCA? | Plagiarism Today
Is this the future of music? We continue to look at more artist revenue streams.
We’ve been waiting for someone to send us this kind of data. This info was provided anonymously by an indie label (we were provided screenshots but anonymized this info to a spreadsheet). Through the cooperative and collaborative efforts of artists such as Zoe Keating and The Cynical Musician we hope to build more data sets for musicians to compare real world numbers.
In our on going quest for openness and transparency on what artists are actually getting paid we’d love to hear from our readers if their numbers and experience are consistent with these numbers below. At the very least, these numbers should be the starting point of larger conversations for artists to share their information with each other.
Remember, no music = no business.
 For whatever reason there appear to be a lot of unmonetized views in the aggregate. So let’s just focus on the plays earning 100% of the revenue pool in the blue set. These are videos where the uploader retains 100% of the rights in the video including the music, the publishing and the video content itself.
| Plays | Earnings | Per Play |
| 2,023,295 | $3,611.84 | $0.00179 |
| 1,140,384 | $2,155.69 | $0.00189 |
| 415,341 | $624.54 | $0.00150 |
| 240,499 | $371.47 | $0.00154 |
| 221,078 | $313.47 | $0.00142 |
| TOTALS | TOTALS | AVERAGE |
| 4,040,597 | $7,077.01 | $0.00175 |
So it appears that YouTube is currently paying $1,750 per million plays gross.
We understand that people reading this may report other numbers, and that’s the point. There is no openness or transparency from either Spotify or YouTube on what type of revenue artists can expect to earn and under what specific conditions. So until these services provide openness and transparency to musicians and creators, “sharing” this type of data is going to be the best we’re going to be able to do as East Bay Ray comments in his interview with NPR.
As we’re now in a world where you need you need a million of anything to be meaningful here’s a benchmark of where YouTube ranks against Spotify.
| Service | Plays | Per Play | Total | Notes |
| Spotify To Performers/Master Rights | 1,000,000 | 0.00521 | $5,210.00 | Gross Payable to Master Rights Holder Only |
| Spotify To Songwrtiers / Publishers | This revenue is for the same 1m Plays Above | 0.000521 | $521.00 | Gross Payable to Songwriter/s & Publisher/s (estimated) |
| YouTube Artist Channel | 1,000,000 | 0.00175 | $1,750.00 | Gross Payable for All Rights Video, Master & Publishing |
| YouTube CMS (Adiam / AdRev) ** | 1,000,000 | 0.00032 | $321.00 | Gross Payable to Master Rights Holder Only |
The bottom line here is if we want to see what advertising supported free streaming looks like at scale it’s YouTube. And if these are the numbers artists can hope to earn with a baseline in the millions of plays it speaks volumes to the unsustainability of these models for individual creators and musicians.
Meet the New Boss: YouTube’s Monopoly on Video | MTP
It’s also important to remember that the pie only grows with increased revenue which can only come from advertising revenue (free tier) and subscription fees (paid tier). But once the revenue pool has been set, monthly, than all of the streams are divided by that revenue pool for that month – so the more streams there are, the less each stream is worth.
All adrev, streaming and subscription services work on the same basic models as YouTube (adrev) and Spotify (adrev & subs). If these services are growing plays but not revenue, each play is worth less because the services are paying out a fixed percentage of revenue every month divided by the number of total plays. Adding more subscribers, also adds more plays which means that there is less paid per play as the service scales in size.
This is why building to scale, on the backs of musicians who support these services, is a stab in the back to those very same artists. The service retains it’s margin, while the artists margin is reduced.
RELATED:


You must be logged in to post a comment.