Here’s a quote for the ages:
MICHAEL BURRY
One of the hallmarks of mania is the rapid rise and complexity
of the rates of fraud. And did you know they’re going up?
The Big Short, screenplay by Charles Randolph and Adam McKay,
based on the book by Michael Lewis
We have often said that if screwups were Easter eggs, Spotify CEO Daniel Ek would be the Easter bunny, hop hop hopping from one to the next. That’s is not consistent with his press agent’s pagan iconography, but it sure seems true to many people.
This week was no different. Mr. Ek cashed out hundreds of millions in Spotify stock while screwing songwriters hard with a lawless interpretation of the songwriter compulsory license. That interpretation is so far off the mark that he surely must know exactly what he is doing. It’s yet another manifestation of Spotify’s sudden obsession with finding profits after a decade of “get big fast.”
The Bunny’s Bundle
Let’s look under the hood at the part they don’t tell you much about. Mr. Ek evidently has what’s called a “10b5-1 agreement” in place with Spotify allowing staggered sales of incremental tranches of the common stock. Those sales have to be announced publicly which Spotify complied with (we think). And we’ll say it again for the hundredth time, stock is where the real money is at this stage of Spotify’s evolution, not revenue.
As a founder of Spotify, Mr. Ek holds founders shares plus whatever stock awards he has been granted by the board he controls through his supervoting stock that we’ve discussed with you many times. These 10b5-1 agreements are a common technique for insiders, especially founders, who hold at least 10% of the company’s shares, to cash out and get the real money through selling their stock.
A 10b5-1 agreement establishes predetermined trading instructions for company stock (usually a sale so not trading the shares) consistent with SEC rules under Section 10b5 of the Securities and Exchange Act of 1934 covering when the insider can sell. Why does this exist? The rule was established in 2000 to protect Silicon Valley insiders from insider trading lawsuits. Yep, you caught it–it’s yet another safe harbor for the special people. Presumably Mr. Ek’s personal agreement is similar if not identical to the safe harbor terms because that’s why the terms are there.
As MusicBusinessWorldWide reported, Mr. Ek recently sold $118.8 million in shares of Spotify at roughly the same time that he likely knew Spotify was planning to change the way his company paid songwriters on streaming mechanicals, or as it’s also known “material nonpublic information”.
As Tim Ingham notes in MusicBusinessWorldwide, Mr. Ek has had a few recent sales under his 10b5-1 agreement: “Across these four transactions (today’s included), Ek has cashed out approximately $340.5 million in Spotify shares since last summer.” Rough justice, but I would place a small wager that Ek has cashed out in personal wealth all or close to all of the money that Spotify has paid to songwriters (through their publishers) for the same period. In this sense, he is no different than the usual disproportionately compensated CEOs at say Google or Raytheon.

Spotify Shoves a “Bundled” Rate on Songwriters
Spotify’s argument (that may have caused a jump in share price) claims that its recent audiobook offering made Spotify subscriptions into a “bundle” for purposes of the statutory mechanical rate. (While likely paying an undiscounted royalty to the books.)
That would be the same bundled rate that was heavily negotiated in the 2021-22 “Phonorecords IV” proceeding at the Copyright Royalty Board at great expense to all concerned, not to mention torturing the Copyright Royalty Judges. These Phonorecords IV rates are in effect for five years, but the next negotiation for new rates is coming soon (called Phonorecords V or PR V for short). We’ll get to the royalty bundle but let’s talk about the cash bundle first.
You Didn’t Build That
Don’t get it wrong, we don’t begrudge Mr. Ek the opportunity to be a billionaire. We don’t at all. But we do begrudge him the opportunity to do it when the government is his “partner” so they can together put a boot on the necks of songwriters. This is how it is with statutory mechanical royalties; he benefits from various other safe harbors, has had his lobbyists rewrite Section 115 to avoid litigation in a potentially unconstitutional reach back safe harbor, and he hired the lawyer at the Copyright Office who largely wrote the rules that he’s currently bending. Yes, we do begrudge him that stuff.
And here’s the other effrontery. When Daniel Ek pulls down $340.5 million as a routine matter, we really don’t want to hear any poor mouthing about how Spotify cannot make a profit because of the royalty payments it makes to artists and songwriters. (Or these days, doesn’t make to some artists.) This is, again, why revenue share calculations are just the wrong way to look at the value conferred by featured and nonfeatured artists and songwriters on the Spotify juggernaut. That’s also the point Chris made in some detail in the paper he co-wrote with Professor Claudio Feijoo for WIPO that came up in Spain, Hungary, France, Uruguay and other countries.
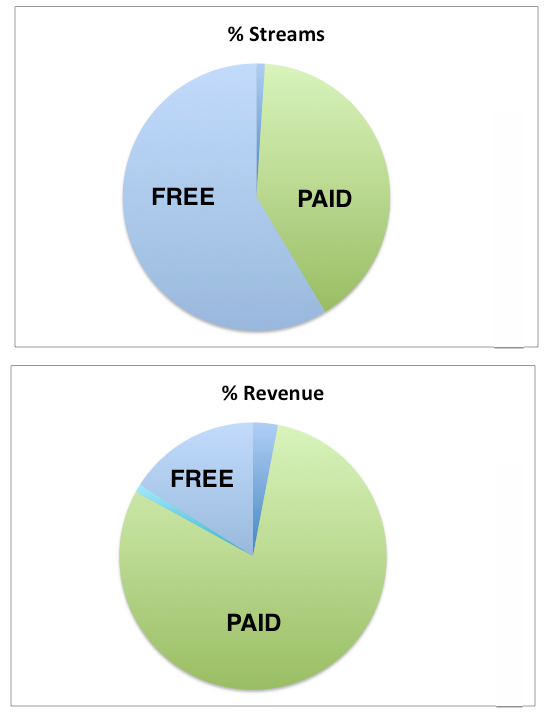
Spotify pays a percentage of revenue on what is essentially a market share basis. Market share royalties allows the population of recordings to increase faster than the artificially suppressed revenue, while excluding songwriters from participating in the increases in market value reflected in the share price. That guarantees royalties will decline over time. Nothing new here, see the economist Thomas Malthus, workhouses and Charles Dickens‘ Oliver Twist.
The market share method forces songwriters to take a share of revenue from someone who purposely suppressed (and effectively subsidized) their subscription pricing for years and years and years. (See Robert Spencer’s Get Big Fast.). It would be a safe bet that the reason they subsidized the subscription price was to boost the share price by telling a growth story to Wall Street bankers (looking at you, Goldman Sachs) and retail traders because the subsidized subscription price increased subscribers.
Just a guess.
The Royalty Bundle
Now about this bundled subscription issue. One of the fundamental points that gets missed in the statutory mechanical licensing scheme is the compulsory license itself. The fact that songwriters have a compulsory license forced on them for one of their primary sources of income is a HUGE concession. We think the music services like Spotify have lost perspective on just how good they’ve got it and how big a concession it is.
The government has forced songwriters to make this concession since 1909. That’s right–for over 100 years. A century.
A decision that seemed reasonable 100 years ago really doesn’t seem reasonable at all today in a networked world. So start there as opposed to the trope that streaming platforms are doing us a favor by paying us at all, Daniel Ek saved the music business, and all the other iconographic claptrap.

The problem with the Spotify move to bundled subscriptions is that it can happen in the middle of a rate period and at least on the surface has the look of a colorable argument to reduce royalty payments. If you asked songwriters what they thought the rule was, to the extent they had focused on it at all after being bombarded with self-congratulatory hoorah, they probably thought that the deal wasn’t “change rates without renegotiating or at least coming back and asking.”
And they wouldn’t be wrong about that, because it is reasonable to ask that any changes get run by your, you know, “partner.” Maybe that’s where it all goes wrong. Because it is probably a big mistake to think of these people as your “partner” if by “partner” you mean someone who treats you ethically and politely, reasonably and in good faith like a true fiduciary.
They are not your partner. Don’t normalize that word.
A Compulsory License is a Rent Seeker’s Presidential Suite
But let’s also point out that what is happening with the bundle pricing is a prime example of the brittleness of the compulsory licensing system which is itself like a motel in the desolate and frozen Cyber Pass with a light blinking “Vacancy: Rent Seekers Wanted” surrounded by the bones of empires lost. Unlike the physical mechanical rate which is a fixed penny rate per transaction, the streaming mechanical is a cross between a Rube Goldberg machine and a self-licking ice cream cone.
The Spotify debacle is just the kind of IED that was bound to explode eventually when you have this level of complexity camouflaging traps for the unwary written into law. And the “written into law” part is what makes the compulsory license process so insidious. When the roadside bomb goes off, it doesn’t just hit the uparmored people before the Copyright Royalty Board–it creams everyone.
David and friends tried to make this point to the Copyright Royalty Judges in Phonorecords IV. They were not confused by the royalty calculations–they understood them all too well. They were worried about fraud hiding in the calculations the same way Michael Burry was worried about fraud in The Big Short. Except there’s no default swaps for songwriters like Burry used to deal with fraud in subprime mortgage bonds.
Here’s how the Judges responded to David, you decide if they are condescending or if the songwriters were prescient knowing what we know now:
While some songwriters or copyright owners may be confused by the royalties or statements of account, the price discriminatory structure and the associated levels of rates in settlement do not appear gratuitous, but rather designed, after negotiations, to establish a structure that may expand the revenues and royalties to the benefit of copyright owners and music services alike, while also protecting copyright owners from potential revenue diminution. This approach and the resulting rate setting formula is not unreasonable. Indeed, when the market itself is complex, it is unsurprising that the regulatory provisions would resemble the complex terms in a commercial agreement negotiated in such a setting.
PR IV Final Rule at 80452 https://app.crb.gov/document/download/27410
It must be said that there never has been a “commercial agreement negotiated in such a setting” that wasn’t constrained by the compulsory license. It’s unclear what the Judges even mean. But if what the Judges mean is that the compulsory license approximates what would happen in a free market where the songwriters ran free and good men didn’t die like dogs, the compulsory license is nothing like a free market deal.
If the Judges are going to allow services to change their business model in midstream but essentially keep their music offering the same while offloading the cost of their audiobook royalties onto songwriters through a discount in the statutory rate, then there should be some downside protection. Better yet, they should have to come back and renegotiate or songwriters should get another bite at the apple.
Unfortunately, there are neither, which almost guarantees another acrimonious, scorched earth lawyer fest in PR V coming soon to a charnel house near you.
Eject, Eject!
This is really disappointing because it was so avoidable if for no other reason. It’s a great time for someone…ahem…to step forward and head off the foreseeable collision on the billable time highway. The Judges surely know that the rate calculation is a farce
But the Judges are dealing with people negotiating the statutory license who have made too much money negotiating it to ever give it up willingly although a donnybrook is brewing. This inevitable dust up means other work will suffer at the CRB. It must be said in fairness that the Judges seem to find it hard enough to get to the work they’ve committed to according to a recent SoundExchange filing in a different case (SDARS III remand from 2020).
That’s not uncharitable–I’m merely noting that when dozens of lawyers in the mechanical royalty proceedings engage in what many of us feel are absurd discovery excesses. When there are stupid lawyer tricks at the CRB, they are–frankly–distracting the Judges from doing their job by making them focus on, well, bollocks. We’ll come back to this issue in future. The dozens and hundreds of lawyers putting children through college at the CRB–need to take a breath and realize that judicial resources at the CRB are a zero sum game. This behavior isn’t fair to the Judges and it’s definitely not fair to the real parties in interest–the songwriters.
Tell the Horse to Open Wider
A compulsory license in stagflationary times is an incredibly valuable gift, and when you not only look the gift horse in the mouth but ask that it open wide so you can check the molars, don’t be surprised if one day it kicks you.

A version of this post first appeared on MusicTech.Solutions


You must be logged in to post a comment.